
From Pod Running to GPU Inference: Rethinking Kubernetes at KubeSummit
September 2026 | KubeSummit 2026 | Dev
A few days ago, I attended KubeSummit 2026 as a complete Kubernetes beginner.
Before the event, my mental model of Kubernetes was a system for managing distributed, containerized workloads through declarative APIs. Rather than telling the system exactly how to perform every step, users describe a desired state through resources such as Deployments and Pods, and controllers continuously work to reconcile the observed state with that desired state.
At the component level, I understood the API server as the entry point for Kubernetes API operations, with API resource state persisted in etcd. Controllers run reconciliation loops. When a Pod needs placement, the scheduler assigns it to a suitable node, and the kubelet on that node works with the container runtime and related components to get it running.
My simplified picture was:
Declare desired state
→ Controllers reconcile
→ Scheduler assigns a node
→ Kubelet gets the Pod running
Several sessions helped fill gaps in my understanding of the cluster infrastructure beneath the LLM inference systems I have been studying. One was Neeraj Pandey’s workshop, “The Scheduler Has Never Heard of NVLink: Topology-Aware GPU Placement on Kubernetes.”
In my original, simplified mental model, a GPU was primarily a resource the scheduler could account for: how many GPU resources a node advertised, and how many a Pod requested.
Under the traditional device-plugin and extended-resource model, a request such as nvidia.com/gpu primarily expresses quantity. Other scheduling constraints still matter, but the GPU request itself does not describe the communication paths between the devices.
Distributed GPU workloads care about more than whether enough GPUs are available. They also care about how those GPUs are connected.
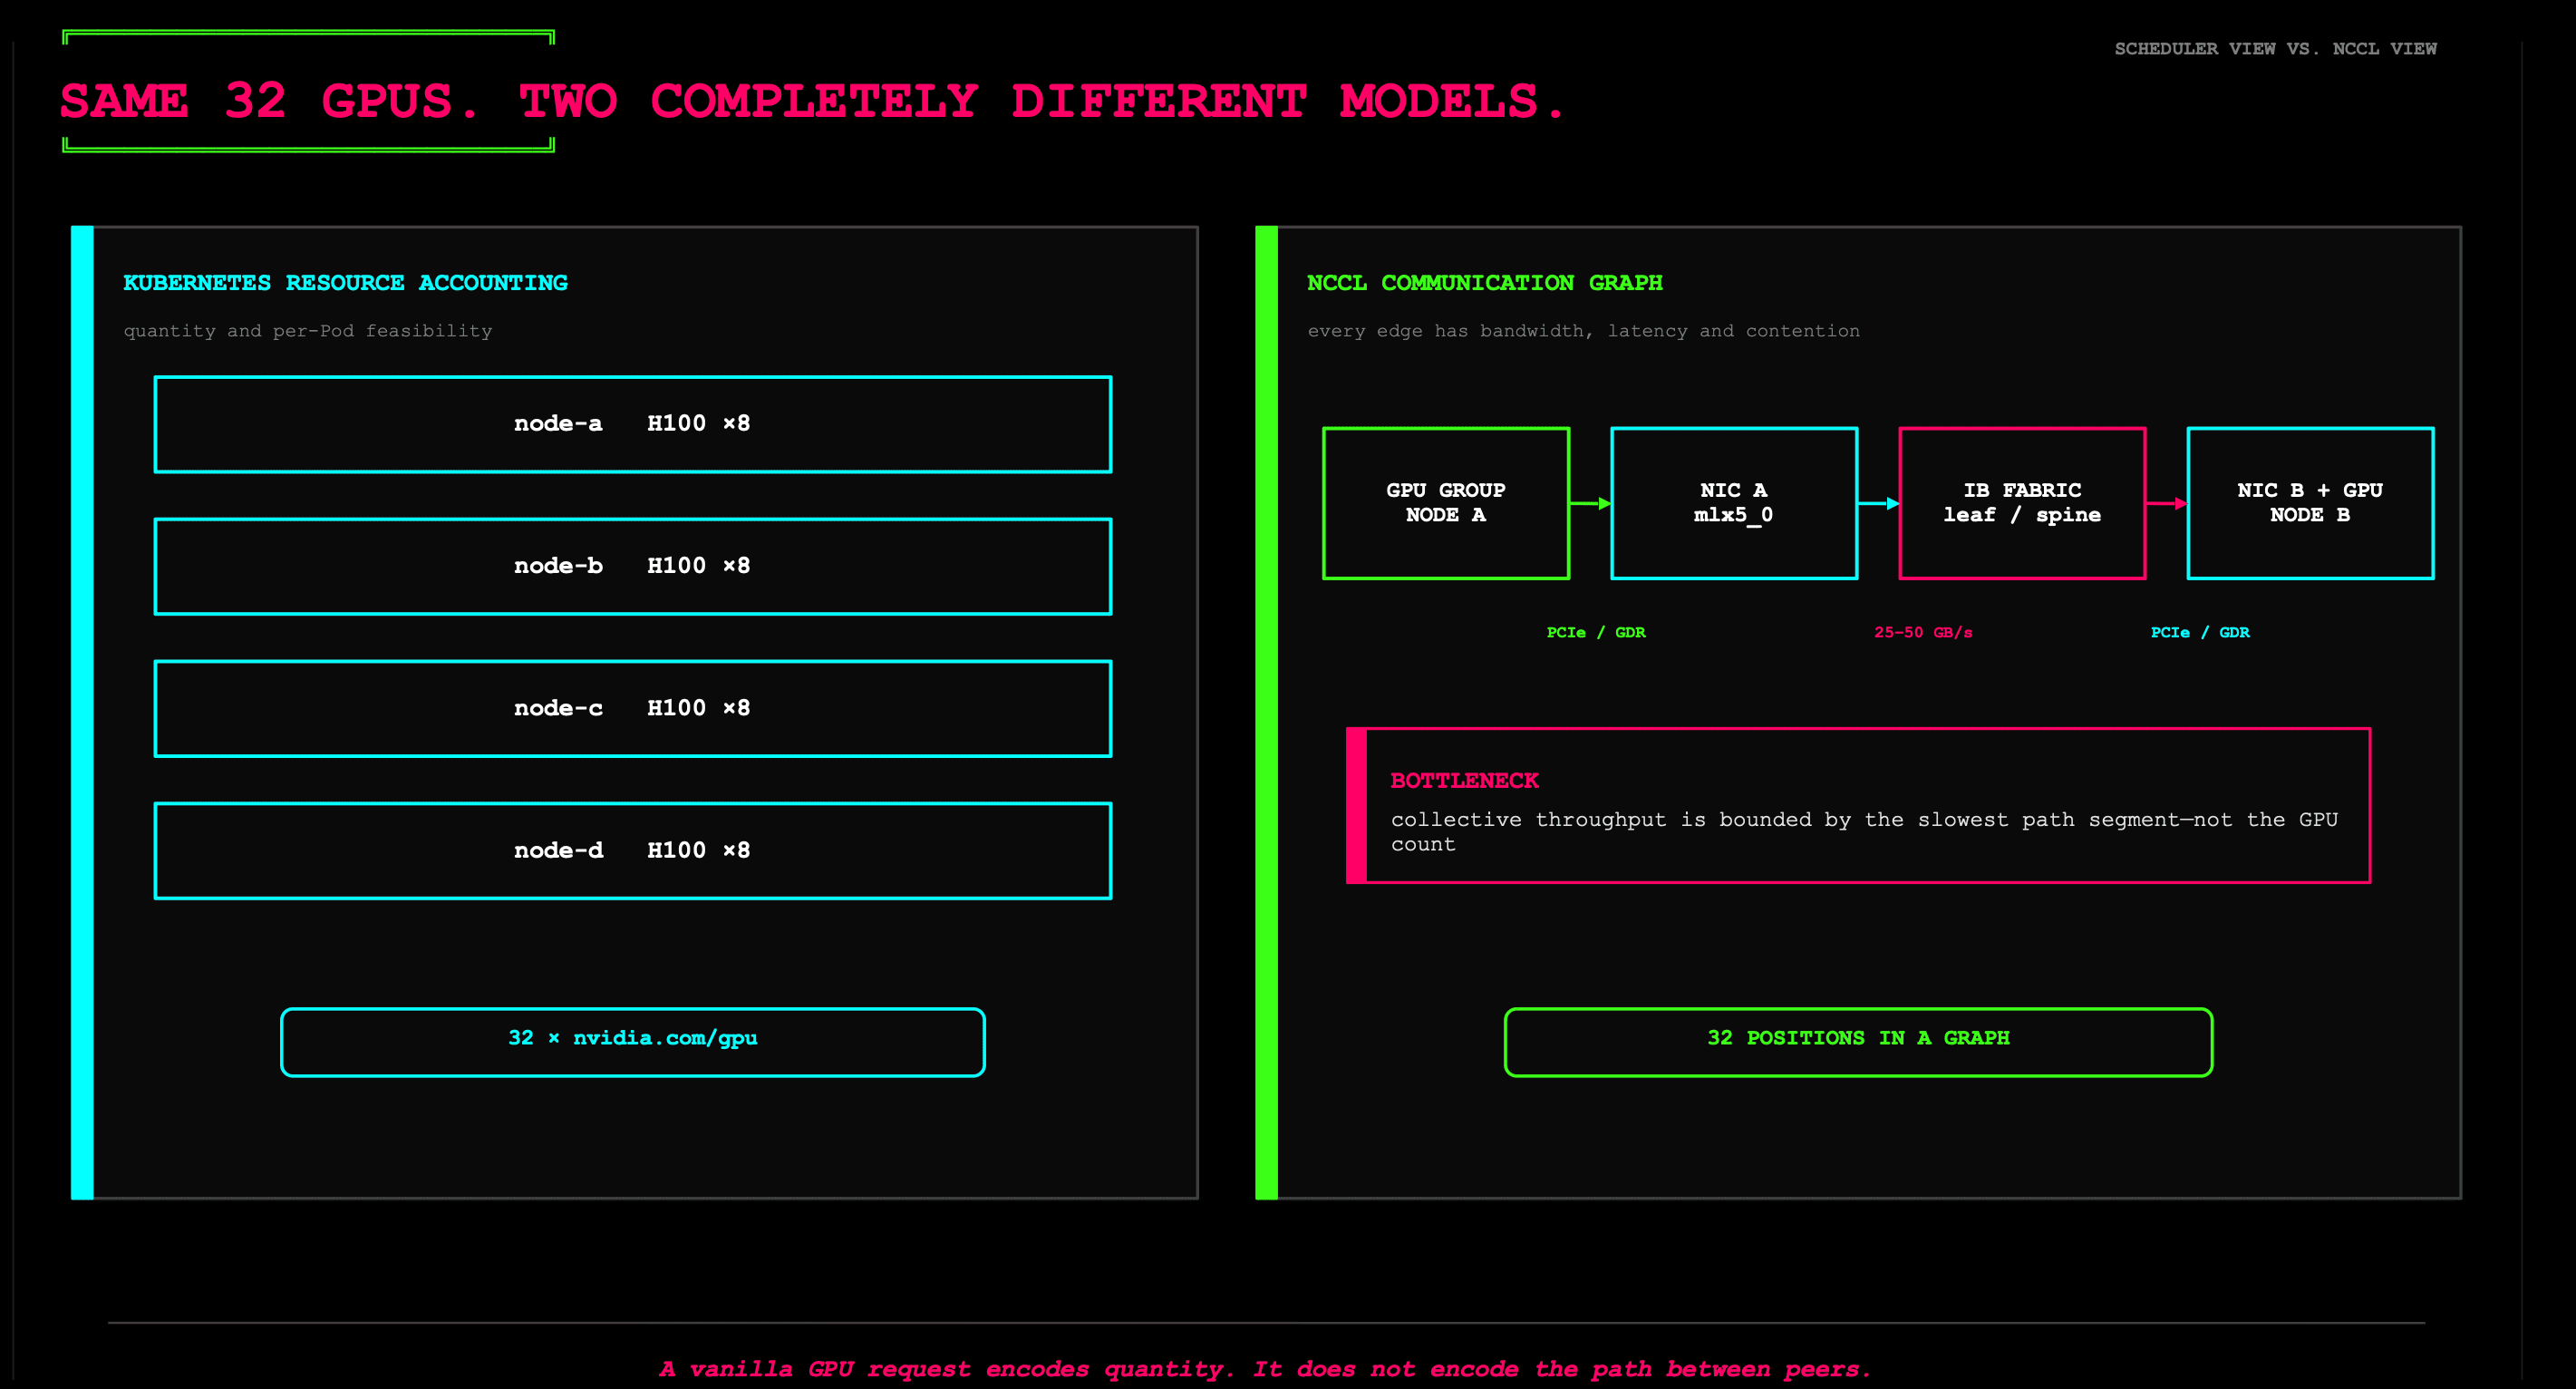
Consider the same set of 32 GPUs. A resource-accounting view might summarize them as node-a: 8 × H100, node-b: 8 × H100, and so on. From a collective-communication perspective, those GPUs occupy different positions in a communication graph. Depending on placement, their communication may traverse NVLink and NVSwitch, PCIe, network adapters, and InfiniBand leaf and spine switches. Those paths have different bandwidth, latency, and contention characteristics.
A quantity-based GPU request describes capacity, not the communication paths between peers.
Does GPU topology matter for inference too?
This led me to connect the workshop back to inference.
Prefill typically has higher arithmetic intensity, while decode, particularly at smaller batch sizes, is often more sensitive to memory bandwidth, including accesses to model weights and the KV cache. The balance changes with the workload. When a model uses tensor parallelism across multiple GPUs, collective communication becomes another important part of the execution cost.
Once a Transformer layer is partitioned across GPUs, the ranks are not operating independently. Depending on the implementation and sharding strategy, different stages may require collectives such as AllReduce, ReduceScatter, or AllGather to exchange or combine intermediate results.
As a simplified mental model:
GPU execution time
≈ Local compute / memory time
+ Non-overlapped communication and synchronization time
This is not a strict timing formula. Actual latency depends on the critical path and how much communication can overlap with computation.
For example, placing an eight-GPU TP group within a single HGX H100 NVSwitch domain creates a very different communication environment from distributing that group across multiple nodes.
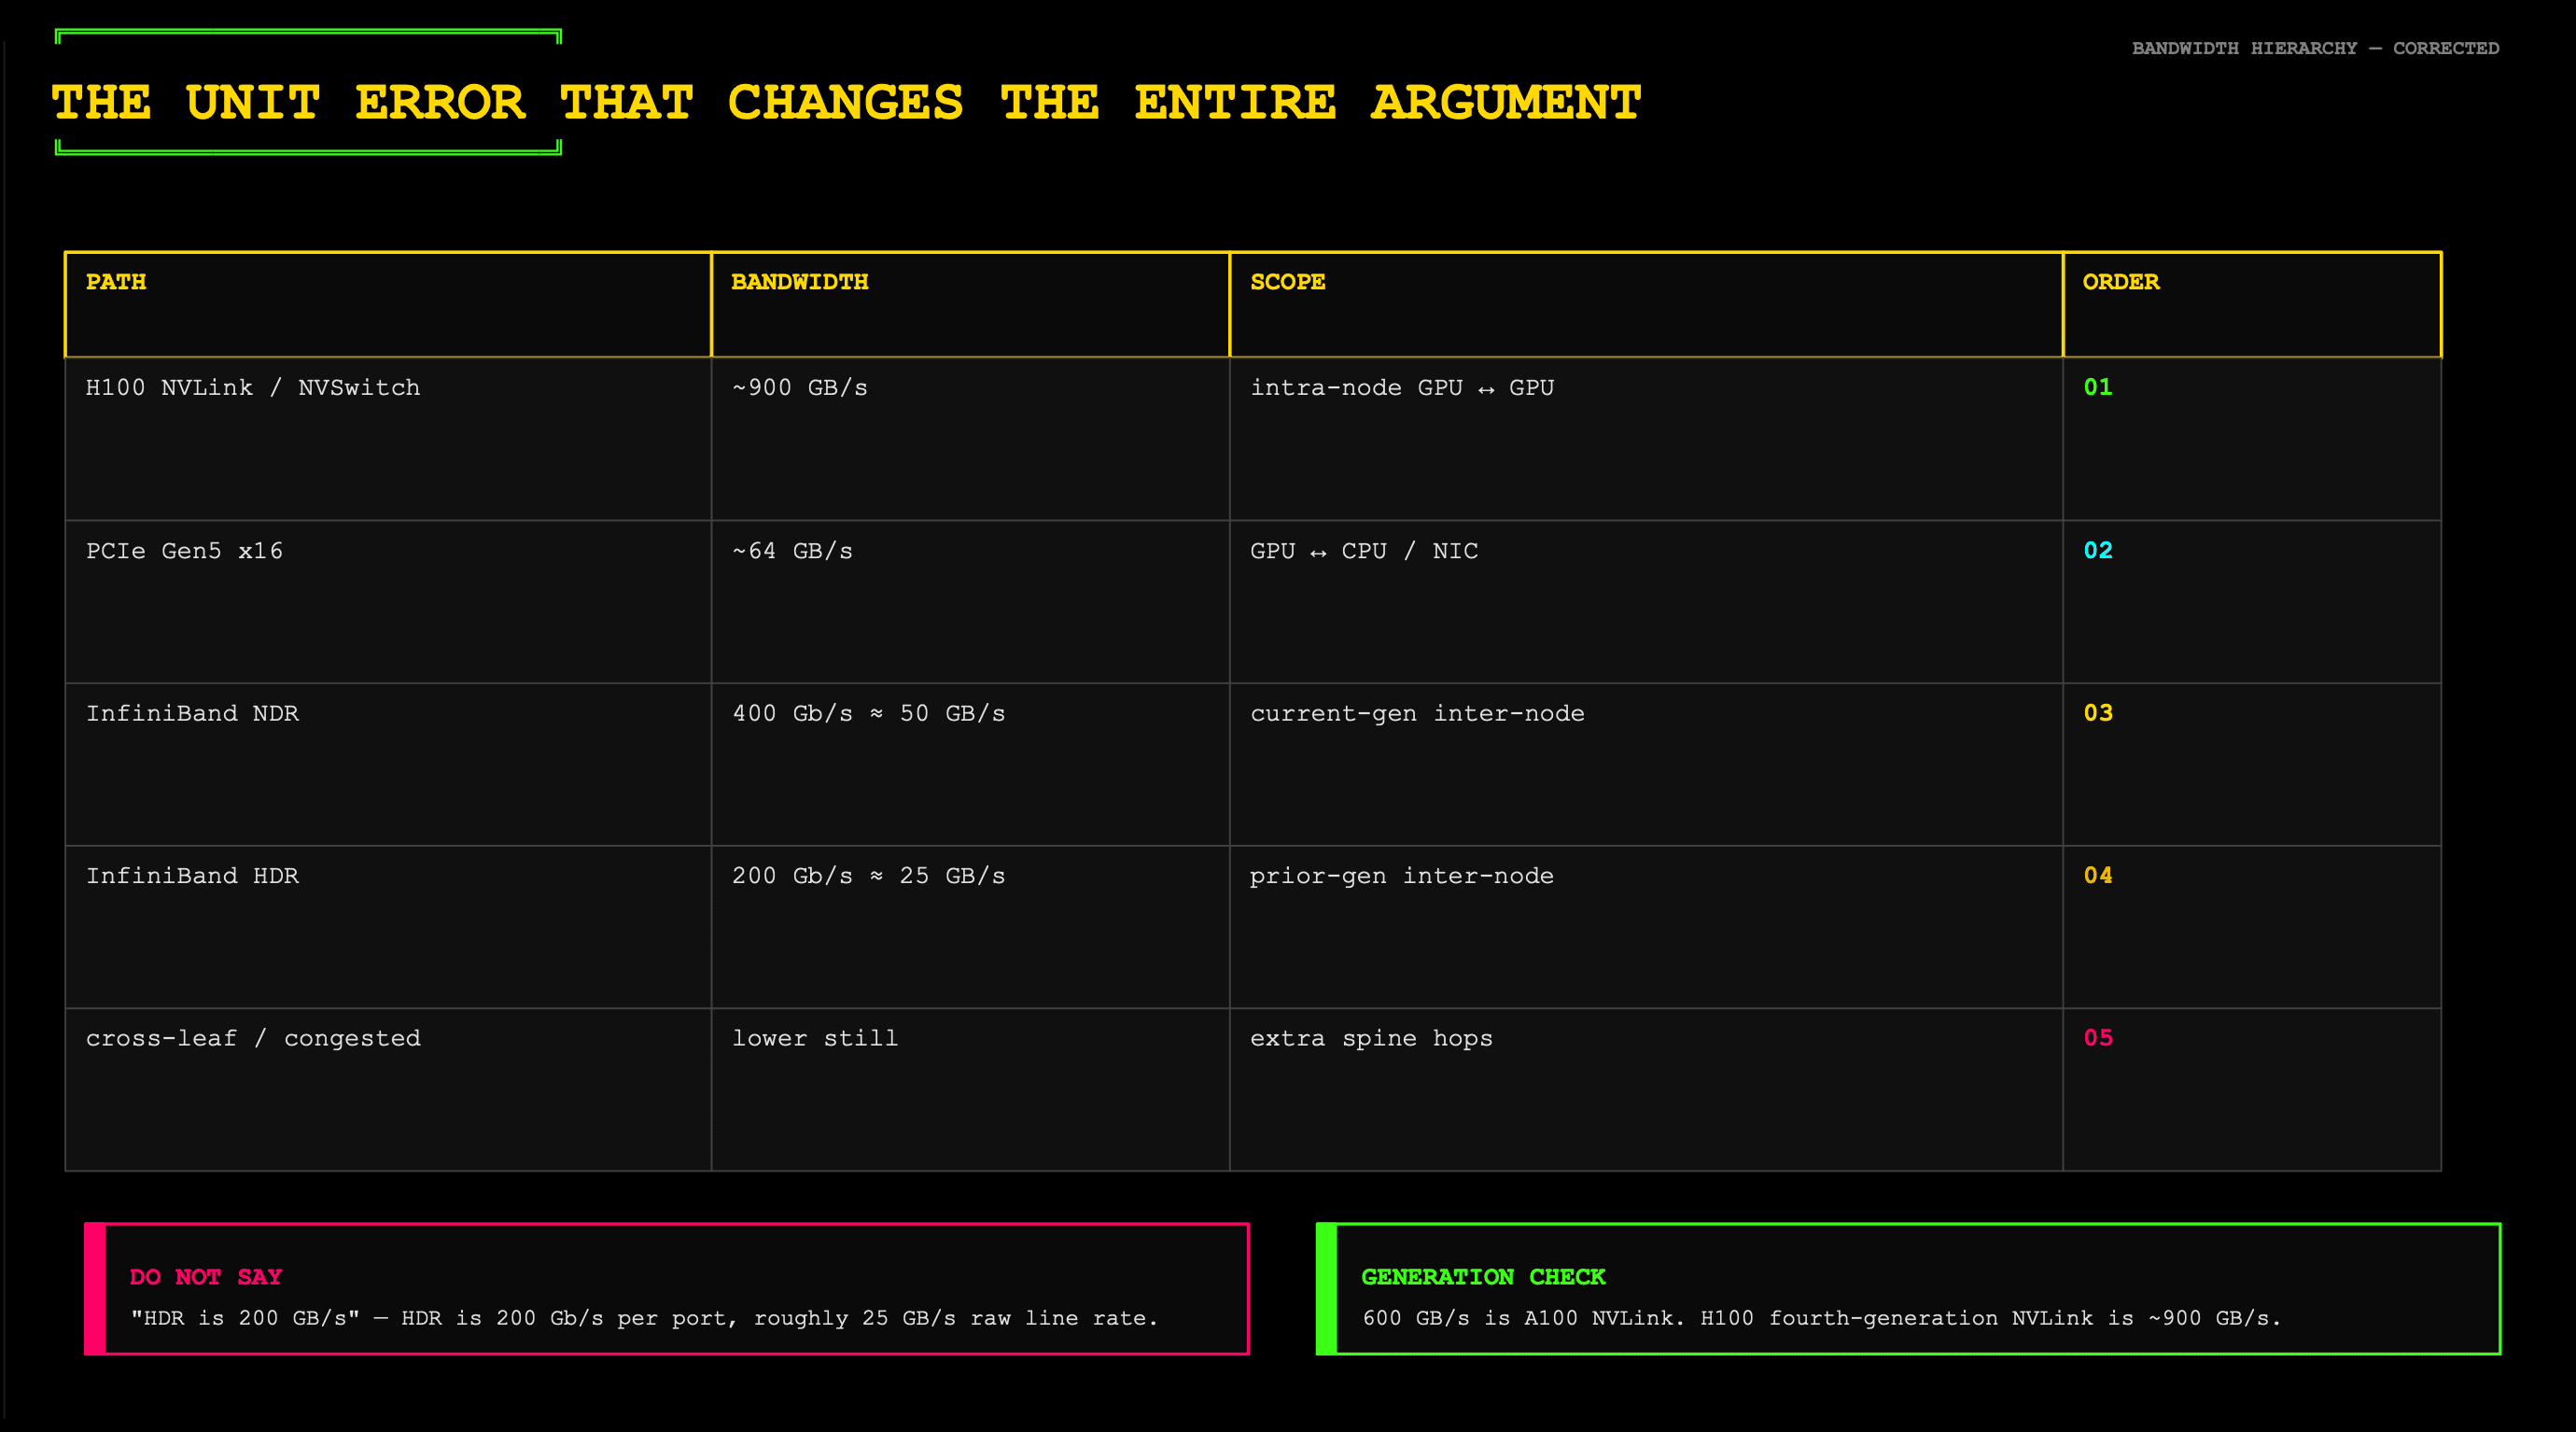
The bandwidth hierarchy helps build intuition, but the numbers need careful interpretation. Each H100 SXM provides up to approximately 900 GB/s of aggregate bidirectional NVLink bandwidth, or roughly 450 GB/s per direction. A single NDR 400 Gb/s network port has a nominal rate of approximately 50 GB/s per direction. The first number is a per-GPU aggregate; the second is a per-port rate. They are not a direct performance ratio, and neither is an NCCL throughput measurement.
Actual inter-node performance also depends on the number of network adapters, rail configuration, fabric design, and congestion. Crossing a leaf-switch boundary does not automatically imply a bandwidth bottleneck.
The broader takeaway remains: GPU locality is a performance variable, including for distributed inference.
How does Kubernetes learn about physical topology?
The architecture I took away from the workshop was to treat infrastructure systems as authoritative sources of topology facts, then translate those facts into a contract Kubernetes can consume.
Network adjacency and fabric information can come from switch and fabric-management APIs, with LLDP providing neighbor information on Ethernet networks and systems such as UFM providing visibility into InfiniBand fabrics.
DCIM systems maintain information about racks, devices, physical locations, and cabling. GPU model and health information can come from discovery and monitoring components managed by the GPU Operator, or from DRA drivers that expose the relevant device attributes and status.
A custom Topology Sync Controller can then continuously reconcile those infrastructure facts into Kubernetes-visible metadata, such as node labels.
With Kueue’s Topology-Aware Scheduling enabled and the appropriate Topology and ResourceFlavor configuration in place, those labels become part of a workload-level placement model.
Kueue can evaluate quota and topology capacity, then calculate a topology assignment for a PodSet. If the workload requires a particular topology level, the PodSet must fit within one domain at that level. A preferred constraint allows broader placement when necessary.
Importantly, Kueue is not merely approving a domain and leaving every placement decision to kube-scheduler. Its topology assignment can identify specific nodes. It then applies constraints such as node selectors, which kube-scheduler respects when completing Pod binding.
Where does cluster topology awareness meet runtime topology awareness?
This is a part of the stack I still want to understand more deeply.
At the cluster level, Kubernetes and Kueue constrain where the Pods hosting a TP group can run. At the runtime level, frameworks such as vLLM and SGLang configure distributed workers and parallel groups, while communication libraries such as NCCL optimize communication over the allocated hardware and available topology.
How do these layers cooperate? Which placement decisions belong in the cluster control plane, and which should remain with the inference runtime? What information needs to cross that boundary?
For me, these are important missing pieces in connecting inference-engine internals with the infrastructure they run on.
Another layer underneath: etcd
Beyond GPU placement, the event also pushed me to think more about the foundations of the Kubernetes control plane.
etcd stores Kubernetes API resource state and uses Raft to maintain consistency across its members. Frequent updates to resources such as Pod status and Events generate write load and MVCC history, making storage management an operational concern.
Compaction removes historical revisions, while defragmentation reclaims unused database space for the filesystem. Alongside health and latency monitoring, these are important parts of keeping etcd reliable.
For deployments with substantial Event traffic, Kubernetes also supports directing Events to a dedicated etcd cluster through per-resource storage overrides, helping isolate that write load from the primary store.
My takeaway is that cluster health is not just about whether Pods get scheduled successfully. The system maintaining the control plane’s state matters just as much.
I arrived thinking mainly about how Kubernetes gets workloads running. I left with a more specific question: what does it take to place those workloads where they can actually run efficiently?